(All numbers are correct as of March 6th 2021)

VAERS stands for vaccine adverse event reporting system. It acts to record and track data when patients have an adverse event after receiving a vaccine. The datasets are fairly easy to access and understand, and this post will go over how to pull and analyze the data.
The VAERS database collects information on the effects of vaccines in the United States. Since we are ramping up a pandemic as of writing this. I thought it would be a dataset to explore since the US plans to vaccine 300 million individuals. This means tons of data to glean insights and make conclusion based on this data.
To begin we need to go over some background information, there are currently two COVID-19 vaccines that have been independently created by different pharmaceutical companies. Here in the US, healthcare providers are required to report all cases in which the vaccine results in an “adverse event.” Reporting false data is punishable by fines and imprisonment (18 U.S. Code § 1001). Adverse events are serious symptoms that result in death, hospitalization, birth defects, or prevent individuals from functioning normally etc. Basically getting the vaccine and experiencing more than the normal symptoms is cause for reporting into the VAERS database.
How to pull VAERS data
To find this dataset you will head over to the VAERS website (vaers.hhs.gov), navigate to the VAERS data tab, scroll down to accept the disclaimer, then click on “Download VAERS data” this will NOT promote a download.
Alternatively you can click the link here (https://vaers.hhs.gov/data/datasets.html?)
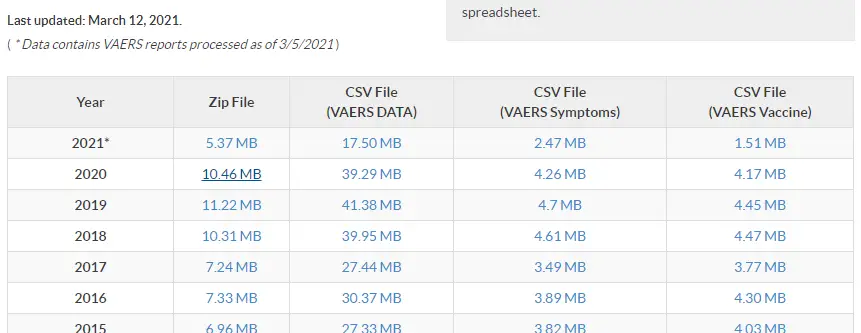
From the link above you will have the option to download 3 CSV (comma separated value) files and 1 zip file. For our purposes we will only need the CSV files (VAERS Symptoms) and (VAERS Vaccine). Download these then open a new Google Sheet. Use the import function under the file tab to pull the data into our Google sheet.
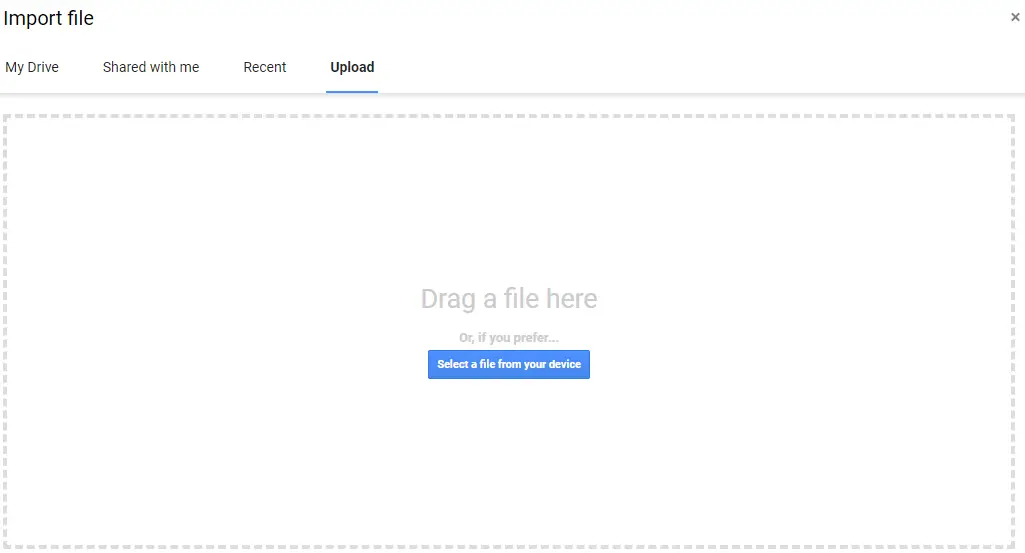
You can either drag and drop, or find the CSV files in your storage and add it.
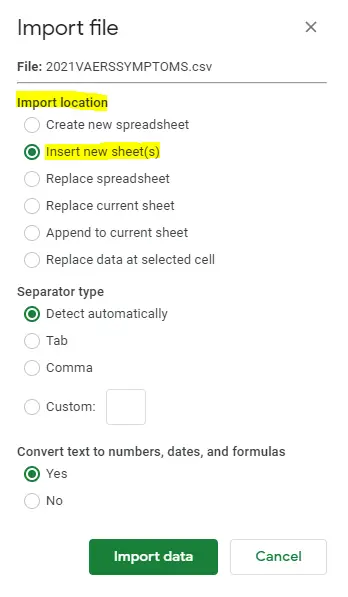
With Google Sheets, import location is the main setting you should pay attention to at this point. Make sure you do not override existing data, and are conscious when you are importing to. I prefer to use the “Insert new sheet(s)” setting.
Next, we will import the (VAERS Vaccine) file and use the “Insert new sheet(s)” setting. You should have both datasets in the same file. Example of what the data will look like:

At this point our data is pulled, and we can start playing and analyzing with it.
What does the data mean?
Once you have the data imported, then we need to make sense of what the columns mean.
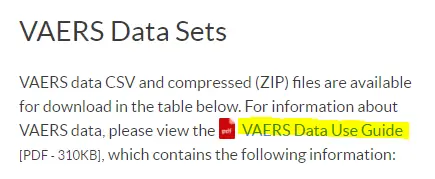
In most government data sources they provide a guide to understand the data. For the VAERS data sets it’s the PDF file that is found here (https://vaers.hhs.gov/data/datasets.html?). I also recommend spending a couple minutes looking for a guide that will help a great deal!
In the (VAERS Symptoms) dataset we can see that each there are up to five different SYMPTOM columns, along with a VAERS_ID column. If we look closely we can see that there are some duplicate values for the VAERS_ID column. From the PDF guide, this means that the same patient reports multiple symptoms. We can also just ignore the SYMPTOMVERSION columns since all the values are the same.

In the (VAERS Vaccine) dataset we also see it has a VAERS_ID column, this will help us in comparing the two datasets with each other. Next we see VAX_TYPE, if we click on the column and add a chart, then aggregate the data we can see a distribution of the data. Makes sense that a majority of the entries are from COVID-19 vaccines (currently finishing up a pandemic).
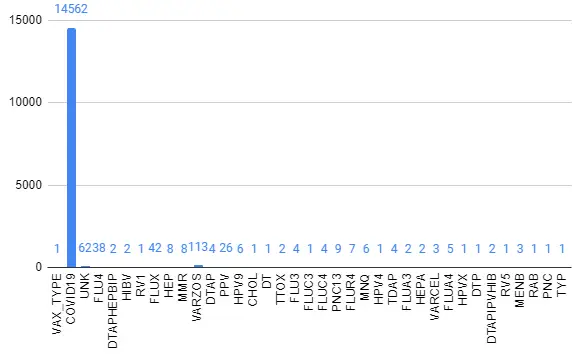
We can also see who the manufacturer is of the vaccine under VAX_MANU column. Full list of the column names and meanings here:

The important part with this step to familiarize yourself with what the data means in real life terms and where it came from.
Analyzing the Data
Now that we understand what the data means, and we have in one place we can start to analyze the data. To do this we first need a question that our data can answer. Data is extremely valuable information, but to get that value we need to ask the right questions. That is what the word analyst means in titles such as Data Analyst.
Here are some basic questions I will answer with this dataset:
- How many deaths are reported from COVID-19 vaccines?
- What is the reported chance you die after receiving a COVID-19 vaccine?
- What is the chance an adverse event is recorded after receiving a COVID-19 vaccine?
Information for first question
For the first question, we can just use the first dataset (VAERS Symptoms). Based on the current structure with some duplicate rows and multiple symptom columns. We need a way to count the number of times death occurs for each ID number. There are quite a few ways to do this, but I will show you the easiest method for this dataset.
Click on the left corner of the sheet the blank spot between A and 1. Then click on the create filter icon, this should change the color of the sheet from gray to green.

Information for second question
For the second question we need all of the deaths reported. From the dataset, deaths are labeled as symptoms. Since there are 5 symptoms per row, and each row has a chance to be a duplication. This is where using our brain comes in, if a patient has a duplicate row with up to five symptoms per row. Then we can ignore the issue of duplicates in this instance. If a patient dies it’s impossible for more symptoms to occur for that same patient.
With this in mind we can just count the number of rows that a form of death appears in for each symptom then add all the values together to get the total. To do this we can create a filter, clear the selected values the type “death” and select all the ones that appear.
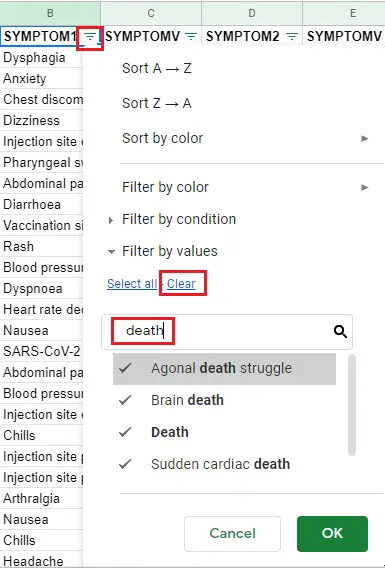
Then using the count function on the bottom right we can see count shows a value of 569 then minus one for the header we get 568 for the number of deaths under SYMPTOM1.

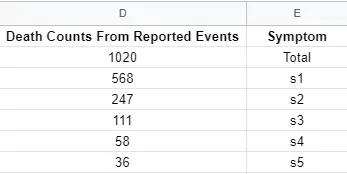
Then repeat this process for each SYMPTOM column and get a list like this:
Information for third question
For the last question in our list, we simply need to copy paste the VAERS_ID column into a new sheet. Then use the remove duplicates feature under the data tab to get the number of unique IDs.
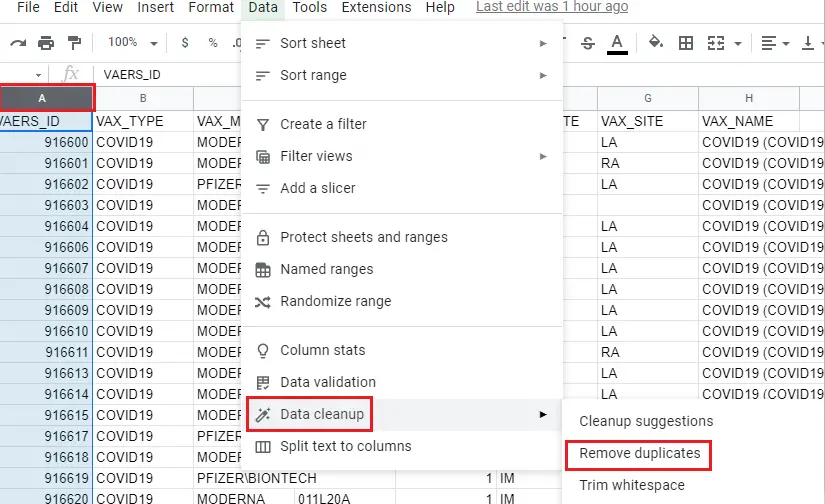
Alternatively, the newest version of Google Sheets has a feature called column stats, which has all information related to the column such as unique values.
Now we have all the information from the dataset to answer our questions
Summarizing the results
How many deaths are reported from COVID-19 vaccines?
As of March 6th 2020, there have been 87,900,000 doses administered (Google search) and from the VAERS dataset there are 1020 total deaths reported as an adverse event after a vaccine has been administered.
What is the reported chance you die after receiving a COVID-19 vaccine?
We can take the number of deaths reported from the VAERS dataset, and the total number of vaccinations administered to get the probability. That is 1020 deaths divided by 87,900,000 doses which comes out to 0.00001160409556 or 0.0012% of dose resulted in deaths.
What is the chance an adverse event is recorded after receiving a COVID-19 vaccine?
We will use the same approach as above, but instead of looking at the deaths we will need to just count the number of unique rows in the dataset. This will give us the total number of adverse events reported. As of March 6th 2020, there are 14,397 unique adverse events reports. This comes out to 0.000163788395904436 or 0.0164% of doses resulted in an adverse event.

Hope this guide helped you learn something new!
Hi Terrence! Nice blog! Thanks for making stats accessible. In the sub-heading and in your article, you wrote that “All numbers are correct as of March 6th 2020”. Did you mean 2021?
Thanks!
Hi!
Glad you like the blog, and hope this post was insightful! Yes, the date should be 2021 thanks for point that out!