

This post will go over how to pull, clean, organize, visualize, and analyze Strava running data with Google Sheets. Our goal is to track running performance and efforts over time.
By default Strava does not offer much insights into how your running activities are pacing over time. That is if you are improving, getting faster etc. The Strava app shows you miles ran over time, total runs, total distance ran, total time ran and elevation and the averages of these metrics.
Yet, the free version of the app lacks key insights to track performance over time. To see more impactful insights such as pace over time, number of runs per week, and speed over time. We will need to manually do the analysis. This post will show you how to get that information by analyzing the data, and presenting it.
Importing Strava running data
In an earlier post, I went over how to request Strava data here. Assuming you have downloaded the data archive we can start to use the dataset for our own purposes. After extracting the compressed .zip folder which Strava sent via email we are presented with a folder here:

For this guide we want to analyze the activities data or activities.csv, in order to track running performance. Once you have located the CSV file inside the folder we can import into Google Sheets.
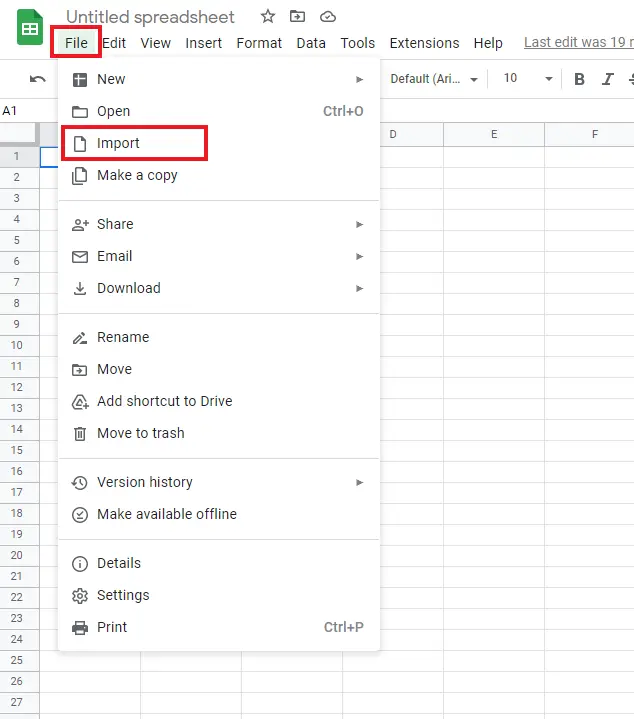
Open a fresh Google Sheet document, then navigate to “file” click then click “import”
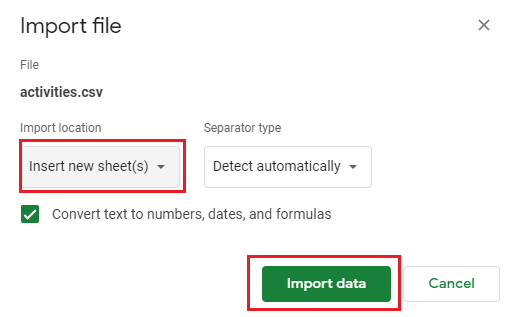
Then look for the “Upload” tab on the window that comes up. Now drag and drop the file “activities.csv.” Select “Insert New Sheet(s)” from the drop down menu, and click import data.
Once the data has been imported, we now need to understand what we are looking at.
Understanding the Strava Running Data
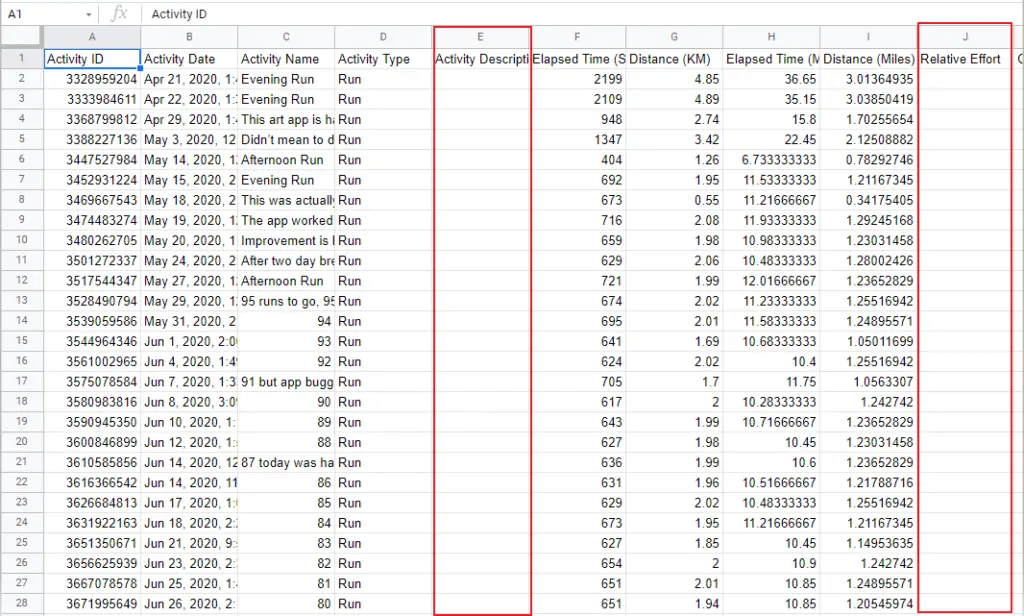
When analyze our Strava running data the first step is being familiar with the data. Understanding the given data is one of the most important steps in any data analysis project. The goal here is to ask ourselves, what do these columns mean, and do the values in the rows mean? Then relate the columns and rows to what is actually happening in real life.
For example, if the column is showing “Elapsed Time” that means the values in the rows will be how the total time that run took to complete.
Cleaning Strava Running Data
A good first step is to delete columns that have no data to clean things up a bit. Let’s start there!
It’s important to note that deleting data is not always advisable, but here we are not technically deleting any data. We are removing columns that contain no values. In general, for data projects if the data is stored elsewhere you can remove what is not needed from the Google Sheet.
Next we want to try and understand all the columns in our dataset, and see how Strava added the values. Since our goal is to track running performance over time, then we want the columns that have data related to performance metrics.
For example the column “Filename” has values that provide a file for each activity. This may not be useful for performance metrics, but may be useful for exporting Strava data into a 3rd party service. Since we want performance metrics this column is not useful to use with this project, hence we will remove it.
Deciding Column Names
We will use the following reasoning for deciding if we need specific columns or not. Does this column relate to running performance in any way? If so, we keep the column, and if not we can remove the column for this project
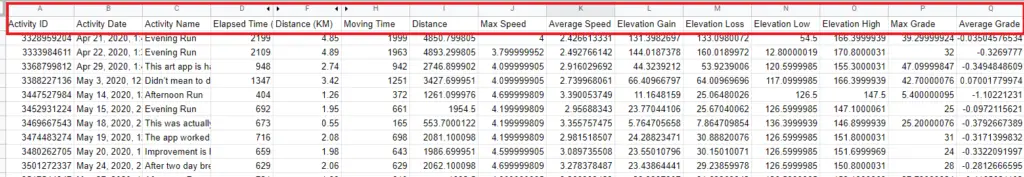
For the purpose of this post I kept the following columns and removed the rest.
Activity ID
Activity Date
Activity Name
Elapsed Time
Distance
Moving Time
Max Speed
Average Speed
Elevation Gain
Elevation Loss
Elevation Low
Elevation High
Max Grade
Average Grade
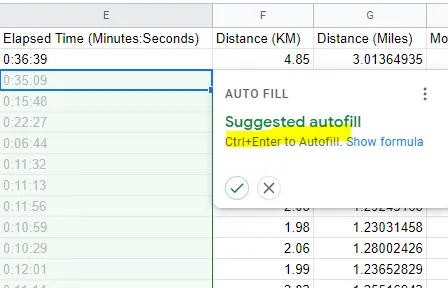
Next we want to try and understand the values for each column. For example, the column “Elapsed Time” has the time in seconds. But not everyone reads elapsed time in second, and most long distance running uses the format “minutes:seconds”
Then we want to transform the data and create new columns with the data formatted in a way that makes sense for the layman (I live in the United States and we do not use the metric system, hence miles makes more sense for laymen here). To do this, we will create two new columns, one for “Elapsed Time” in the format “minutes:seconds.” Another column for “Distance” but converting the kilometers to miles.
Converting Seconds Into Minutes With Google Sheets
Since Google Sheets does not have a built in formula we need to create our own. We simply cannot just divide the seconds by 60, and have that as the new values. Because we will end up with values such as 36.96. Thus we need a formula to get around this.
Here is the formula for converting seconds into minutes:seconds.
=trunc(D2/3600)&text(mod(D2/86400,1),”:MM:SS”)
Create a new column “Elapsed Time (Minutes:Seconds),” add the formula and edit it based on the column you have “Elapsed Time.” In my case, I have it in the D column so the formula will use the D2 in those two spots and we can then drag and drop to fill in the rest.
=trunc(D2/3600)&text(mod(D2/86400,1),”:MM:SS”)
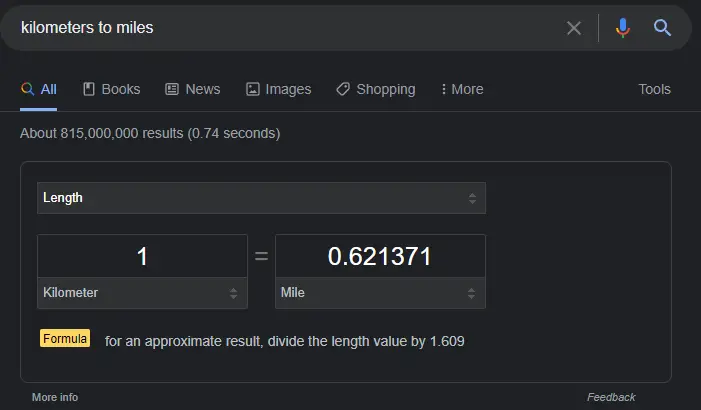
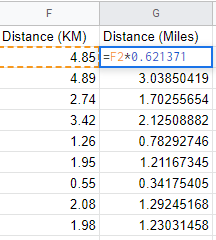
Next we want to convert the kilometers into miles. Simply look up the conversion for this, and we can multiply the kilometers by 0.621371.
Create a new column “Distance (Miles),” add the formula and edit it based on the column you have “Distance.” In my case, I have it in the F column so the formula will use the F2 and we can then drag and drop to fill in the rest.
Analyzing the Data Using Google Sheets
Since we have pulled, cleaned and organized our data we can start to do the fun part and actually analyze our data to gain meaningful insights. With Strava data I am curious about what my running performance has been this past year and how much effort I am putting in. To gauge these factors I looked at my running pace overtime.
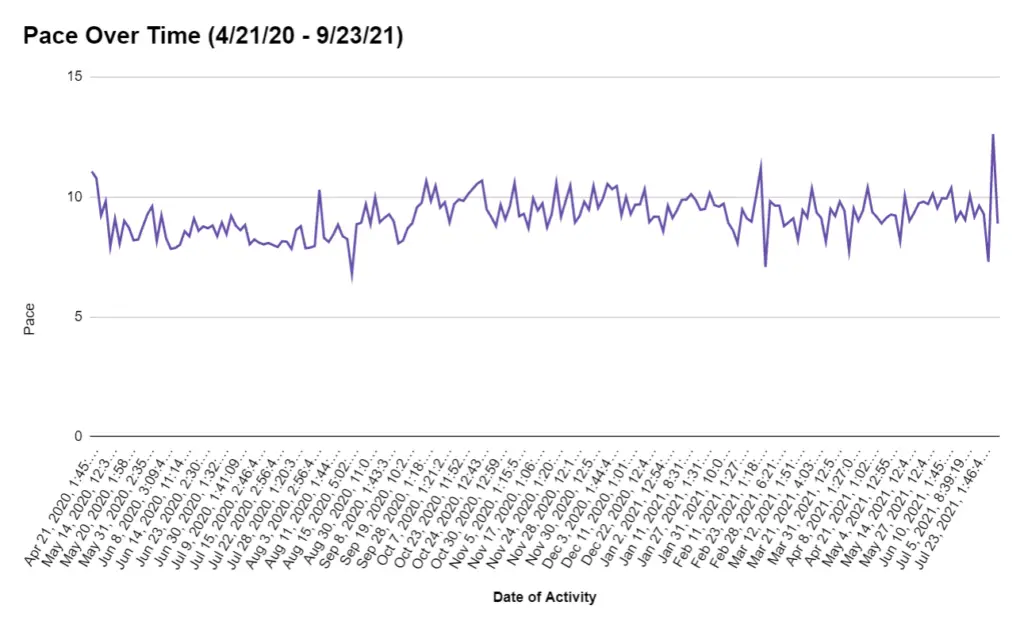
As you can see, my running pace improved initially but then around October / September it reverted back to where I started and averaged about a 9.4 mile pace thereafter.
When the pandemic first started back in April of 2020, I installed Strava and began recording my neighborhood running. My goal was to improve my stamina and to run further. I started to improve my pace, and felt like I was improving. But half way through I started to run just to get it done without pushing myself.
From the data, it is clear this was how I felt about running. At first I was trying hard to improve on previous times and get faster. Yet, over time that mentality turned running into a chore that I just needed to complete. Which is what you see when the pace levels out around October / September.
Thanks to this data that Strava had, I was able to identify the pattern and issue regarding my running. Nowadays I run less but have more drive to improve since I no longer treat running as a chore.
You can find my Google Sheet for the project found here:
https://docs.google.com/spreadsheets/d/1AIErxW9u9XFKJUpibTcN_c70zfC9Cau2nG5uDD2WN6M/edit?usp=sharing
Thanks for reading and let me know how you are running!
After examine a couple of of the blog posts in your website now, and I actually like your manner of blogging. I bookmarked it to my bookmark web site listing and will likely be checking back soon. Pls take a look at my web page as nicely and let me know what you think.
Enjoyed all bit of your blog article. Will way in on
Exactly.