
Time in the market is better than timing the market. When it comes to investing this statement has remained true for the past 100 years. Despite crashes, wars, fluctuations, the great depression, and the dot com bubble. The fact is, keeping your money in the market always outperforms trying to time the market. With this mindset, what is the easiest to track all your investments in order to grow your portfolio and achieve your financial goals overtime?
Whether you are using Robinhood, Fidelity, or any other trading platform it’s important to track the progress of your portfolio to maintain the growth. The easiest way to do it is to create your own personal Google Sheet with custom formulas that requires minimal work to maintain. In this article I will show you how to easily create and use a fully functioning investment tracker using Google Sheets.
Setting up the Google Sheet
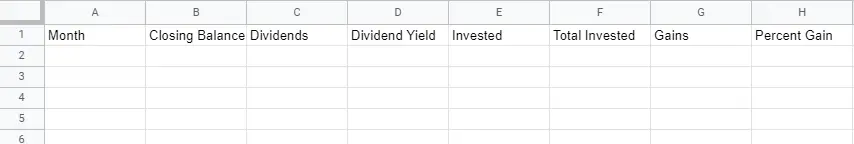
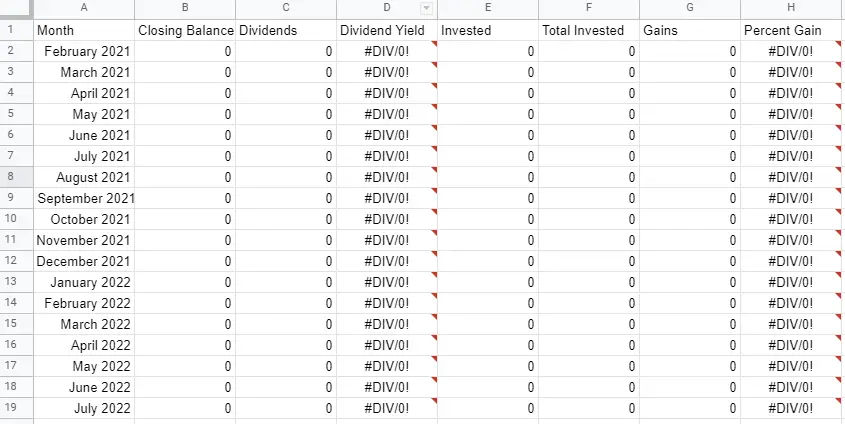
To start we will need to create a new Google Sheet, or if you already have an existing sheet you can just add a tab. In the new sheet add the following column names: Month, Closing Balance, Dividends, Dividend Yield, Invested, Total Invested, Gains, Percent Gain. It should look like this:
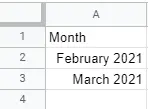
Next fill in the months. This can be a little annoying with sheets, but what you need to do is manually type the month name then the year. Then do this for the next month.
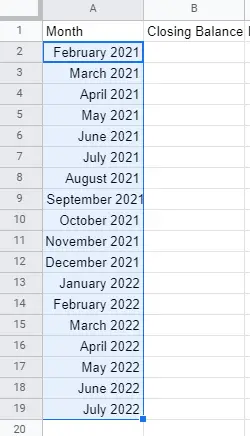
Once you have two months then you can use the drag and drop feature in Google sheets to fill in the rest of the rows. To do this hold the Shift key, and click on both cells. Then click and hold on the bottom right corner of both cells (blue box), and finally drag down to as many rows as you need.
Adding the Formulas
Now that we have the basic framework in place we can add the formulas. If you have the same set up as my example then the following formulas will be exact. But I wrote out the definitions alongside each formula.
Dividend Yield = Dividends / Closing Balance
Formula: = C2/B2
Total Invested = Previous Total Invested + Invested
Formula: = F2 + E3 (Not first cell)
Note: The first cell must be the first value from the invested column of the same month, or = E2
Gains = Closing Balance – Total Invested
Formula: = B2-F2
Percent Gains = Gains / Total Invested
Formula: = G2/F2
If you fill in 0 for all other values your tracker should look like this now.
Getting the Data
With the Google Sheet set up we can now fill in the columns with data. Up to this point this tracker will work for any broker, but to get the data it will depend on the broker that you are using. In this case we will be using Robinhood.
To get your data from Robinhood will need the monthly statement for each month.
To do this, login into your Robinhood account
Go to your account settings, then documents. This will show your account statements and tax documents.
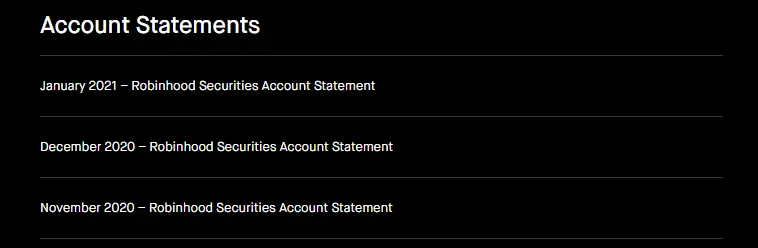
Download all the statements for each month. I prefer to name each statement month_year in order to keep it organized in my folders. Once you have it downloaded, then you can view it.
Robinhood actually has quite clean monthly statements that are easy to read. For each month we will need the following information, Closing Balance, Dividends, and Invested (sum of money in for that month). Since we created all those formulas this part is a lot easier 🙂
For Closing Balance and Dividends the monthly values will be right at the top of the statement.
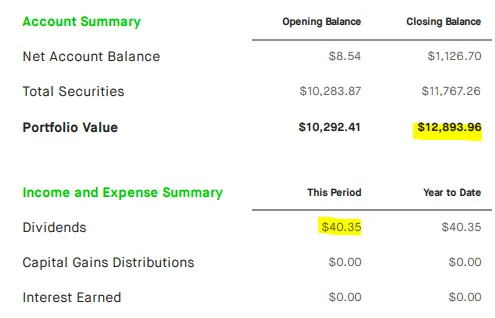
For the Invested column scroll down a bit until you reach the account actively section, then look for all the ACH deposits. Find all the deposits in your account activity for that month, then add the values together. I copy paste each value into a calculator and add them together to make things easier. Once you get the total for the month then put it into the Invested column.
Here is what one month would look like:

In simple steps:
- Download statement (Starting with the first month)
- Copy Closing Balance and Dividends
- Add up deposits, add to the Invested column
Repeat the steps above for each month.
Bringing it all Together
Since we have our tracker complete we can go over how to use it. Every month when your monthly statements are released by your brokerage, you can easily fill in the row for that month. It should only take you a couple of minutes to do so (Way better than browsing instagram for 2 minutes). The formulas will auto fill without you having to think about it, and if you need more rows you can just use the drag and drop method in sheets to create extra rows as needed.
With this tracker complete, maintaining it will only take a couple minutes each month. You can now analyze your investing trends, gains, total invested amount over time and much more. In addition, you can get an idea for portfolio projection overtime if you maintain current investment amounts. You can also see what happens to the effect of long term growth when you increase or decrease your investments.
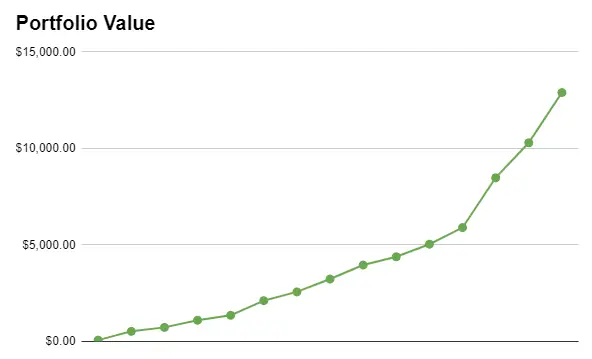
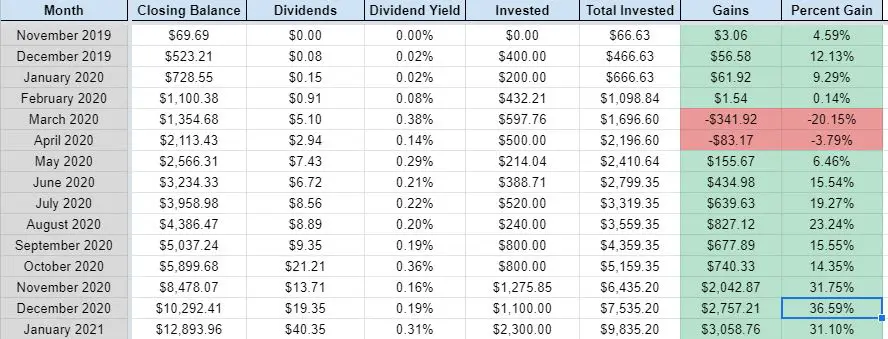
Or if you want to focus more on dividend investing, you can set monthly goals for how much in dividends you want to earn. For example my current goal is to hit $100 per a month in dividend earnings. The possibilities are really endless, but the key thing is anyone can do this. Whether you are starting with investing $100 a month, or currently investing a large amount. The fundamental value from using a tracker will be an invaluable asset to increasing your net worth over time. Here is my progress since November 2019 when I started investing. Anyone can do this if you start now!
If you have any questions feel free to drop them in the comments below. Thanks for reading!
Good day! I just wish to give you a huge thumbs up for your excellent information you have got here on this post. I am coming back to your blog for more soon. Good day! I just wish to give you a huge thumbs up for your excellent information you have got here on this post. I am coming back to your blog for more soon.
Thanks for your blog, nice to read. Do not stop.